
The Problem
Managers can't see the overall skill health of their team at a glance. Trainees have no clear view of their own strengths and gaps against their role, so they can't tell which training would help them most.
Why it matters: Better visibility into team and individual health gives people a reason to come back to the system, which drives long-term use and value.
Who It's For
| Persona | Description | Primary need |
|---|---|---|
| Manager | Leads a team of trainees and is responsible for their skills and compliance | See team health at a glance, spot gaps and at-risk trainees, and assign training to fix them |
| Trainee | Working in a current role and often toward a target role | Understand strengths and gaps and know what to learn next |
Discovery
I started from what the system already knew and where it was already failing people:
- Reviewed the existing data models to set a baseline for what could be shown.
- Reviewed support and bug tickets for related pain points.
- Planned conversations with managers and trainees about how each of them defines training "health."
- Identified the feature points that support the business case.
Requirements
The research became a requirements specification with 15 user stories across a manager epic, a trainee epic and a post-MVP backlog, each with acceptance criteria. Agreeing on what was out of scope (automated alerts, module drop-off metrics, org-wide reporting) kept the MVP small enough to ship.
Read the requirements draft → Read the requirements spec →
Design Decisions
-
Seconds to an answer
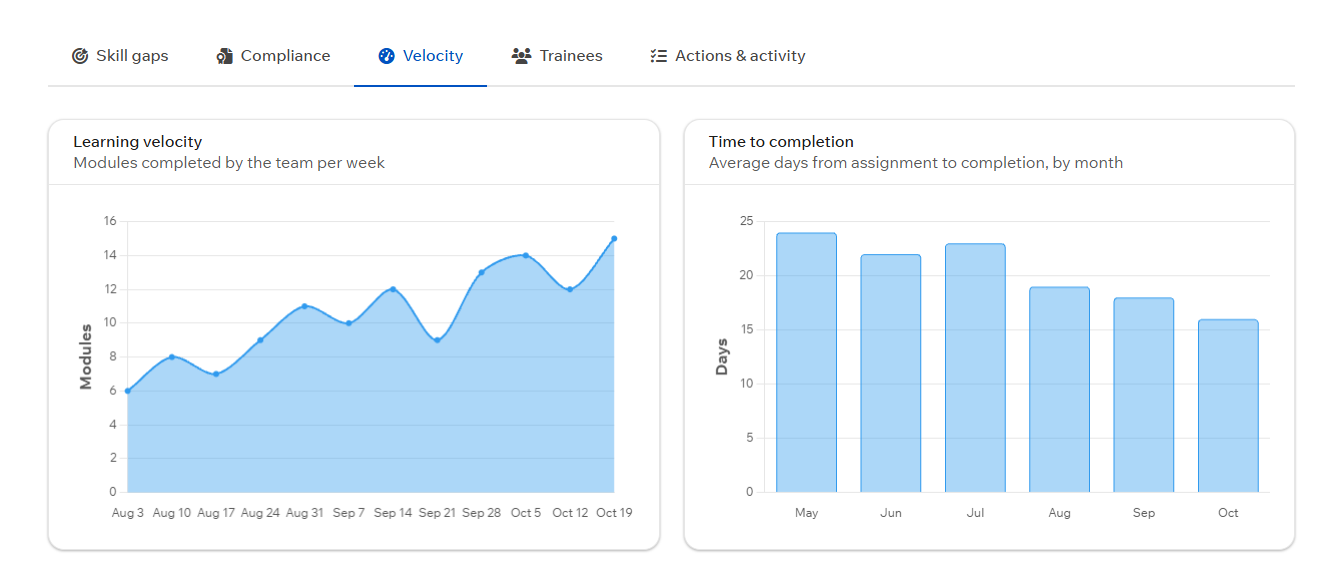
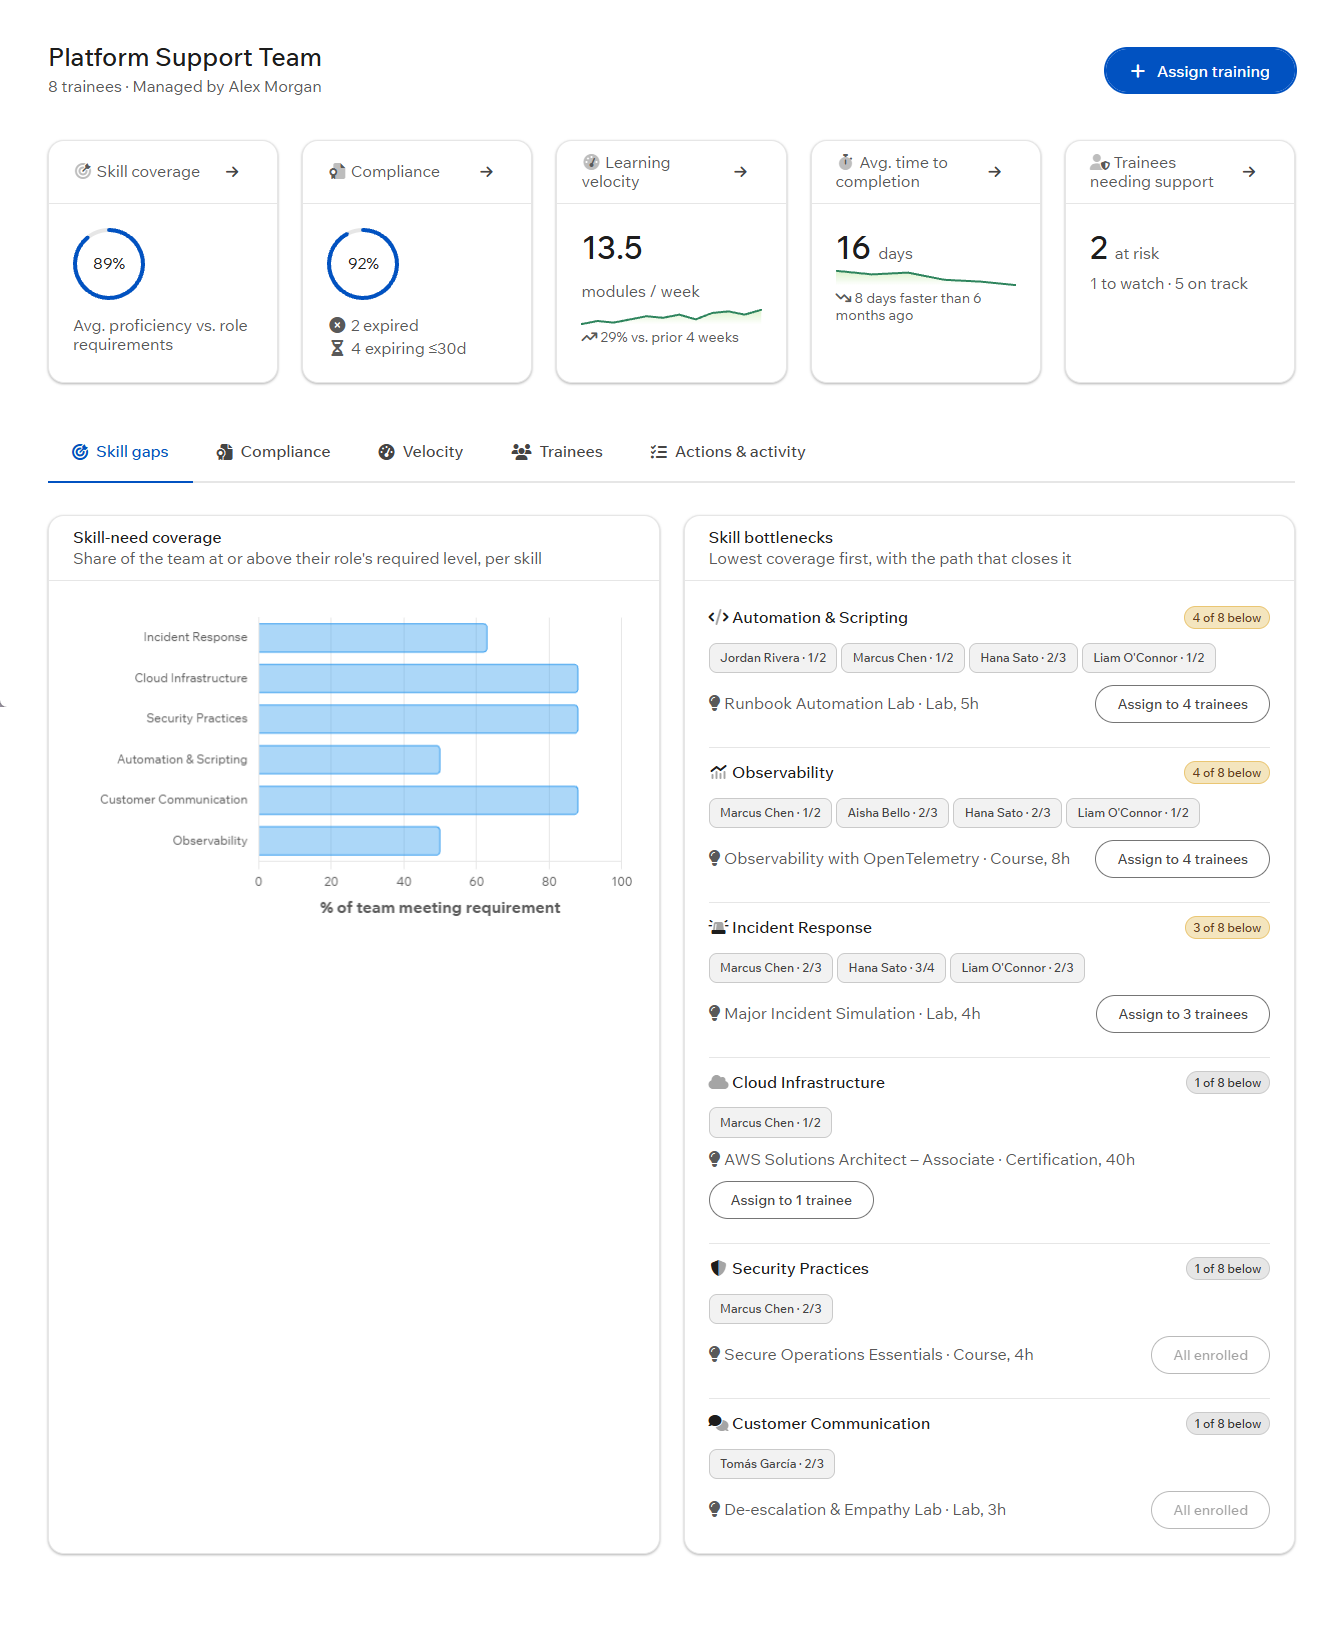
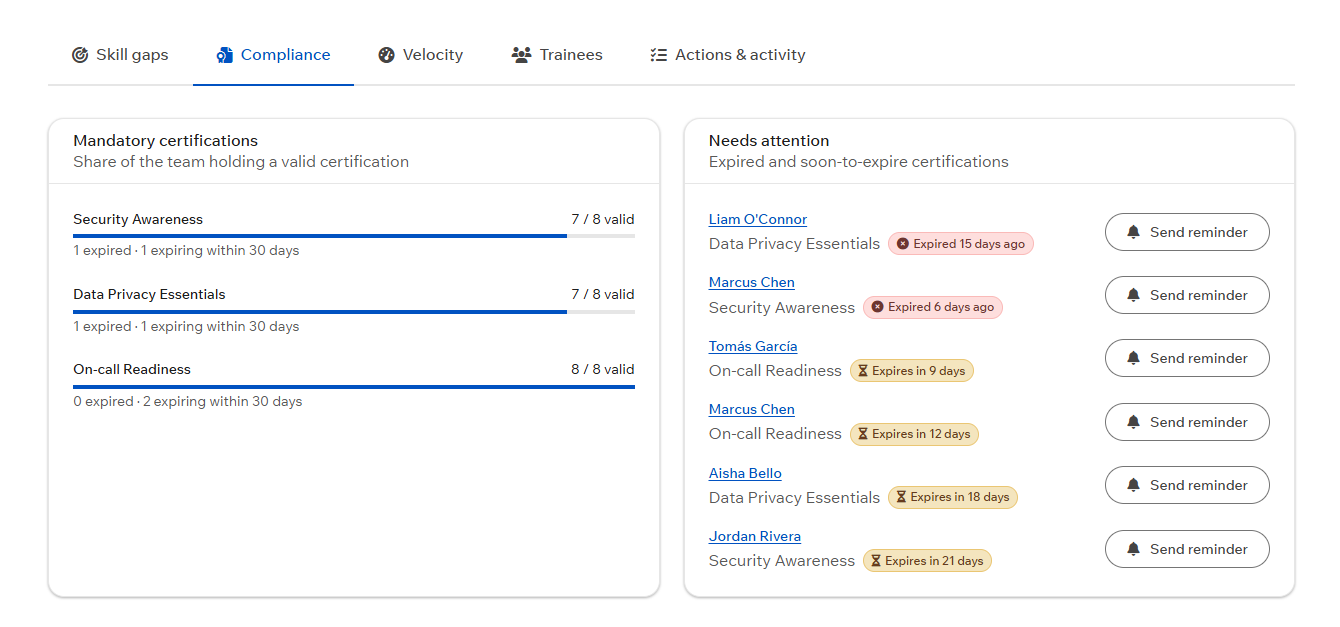
Managers land on five summary cards (skill coverage, compliance, learning velocity, time to completion and trainees needing support). Each card shows a trend and opens its matching detail tab.
-
Every gap comes with a fix
Skill bottlenecks are sorted lowest coverage first. Each one names the trainees below the bar and the course that closes the gap, with a one-click "Assign" action.
-
Same data, two lenses
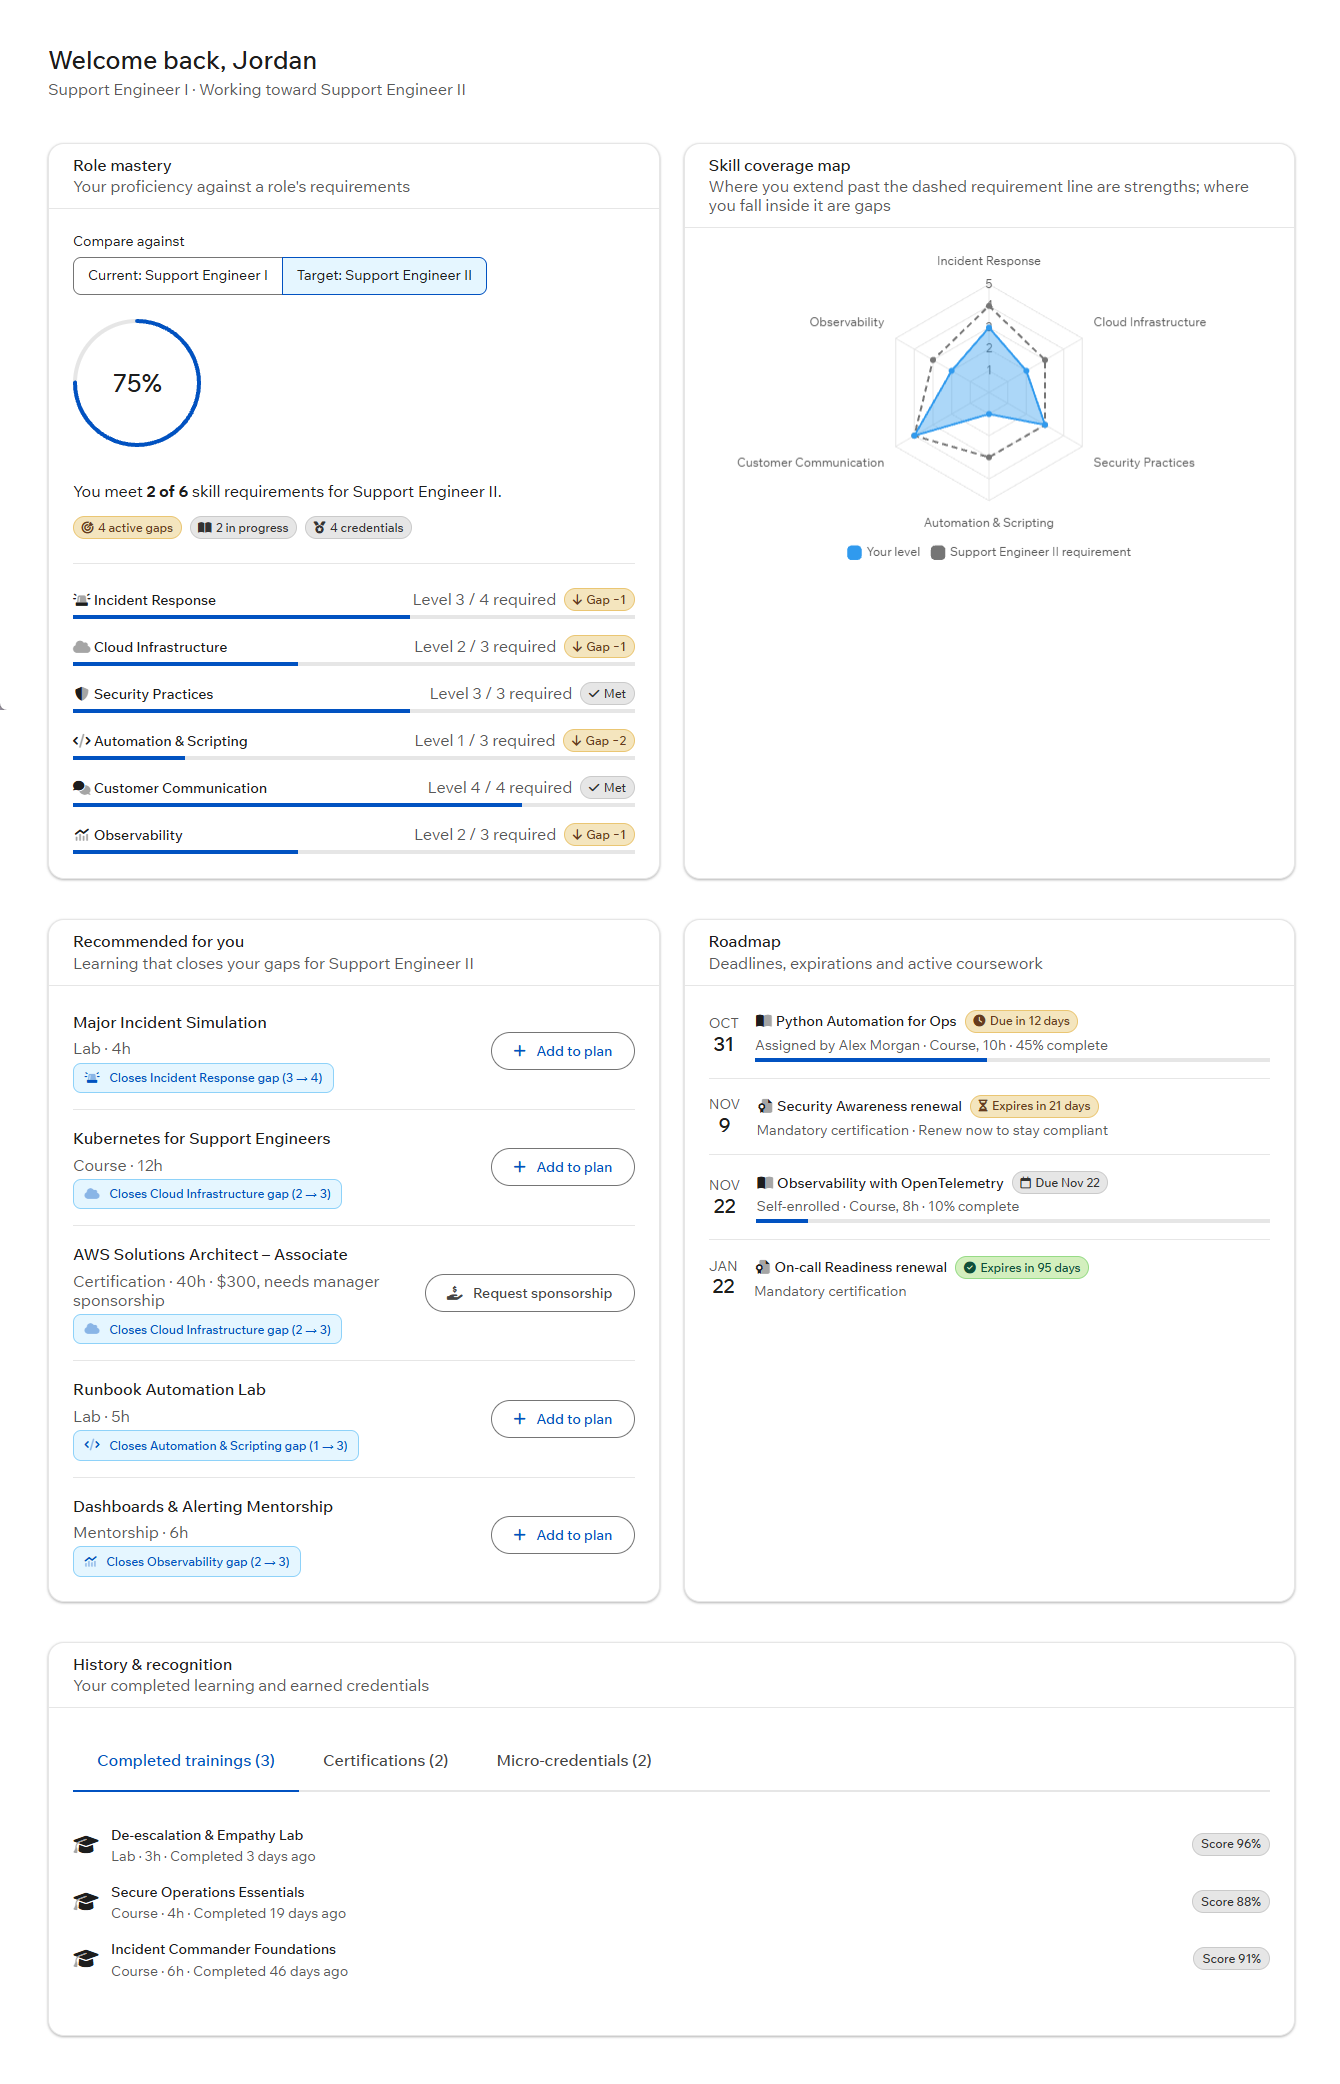
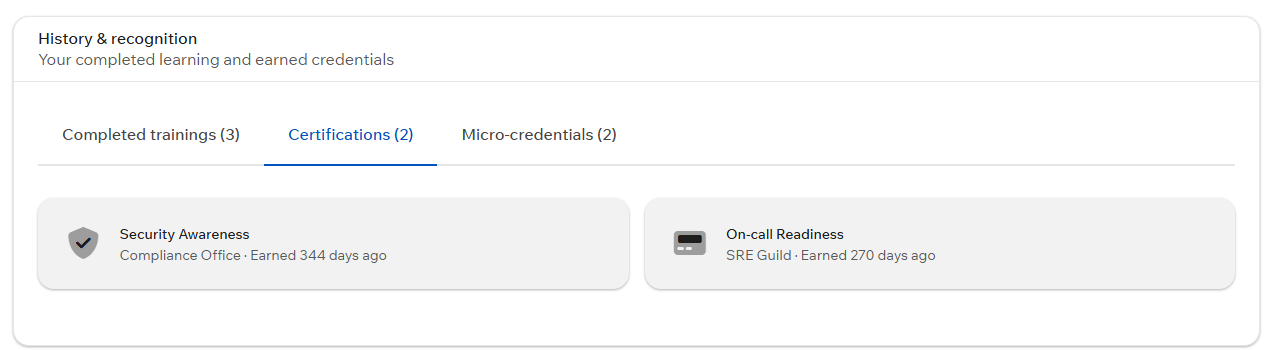
Trainees see the same skill framework turned toward themselves: mastery against their current or target role, a coverage map and recommendations for each of their gaps.
-
No new components
The dashboard is built entirely from the existing design system, so it reads as part of the product rather than a bolt-on, and engineering doesn't have to build anything new. Customization is allowed but should be limited and rationalized.
Measuring Success
| Metric | Target | How It's Measured |
|---|---|---|
| Team skill coverage | Increase vs. baseline | Avg. proficiency vs. role requirements |
| Compliance rate | Increase vs. baseline | % of required certifications current |
| Gap-to-action rate | Increase vs. baseline | % of identified gaps with training assigned or planned |
| Avg. time to completion | Decrease vs. baseline | Days from assignment to completion |
| Dashboard return visits | Increase vs. baseline | Weekly active managers and trainees |
What's Next
The MVP gets the most-needed features out the door. A second pass covers polish and compliance:
- Accessibility: Full keyboard navigation, visible focus states and screen-reader labels, including on charts (WCAG 2.1 AA).
- Training Classification Separate risk-mitigation training from optional upskilling so urgent work comes first.
- Intervention: Alert managers when a trainee stalls, with options to start 1:1 coaching or auto-assign remediation.
- Internal Analytics: Track active learning time and drop-off points, and collect trainee ratings to measure content quality.